“It was called Japan Life”, says Kristen Rutherford, as if remembering a former lover. She’s slightly embarrassed and a little wistful, but she has decided to confess: “I loved this game.”
Kristen is a TV producer and a writer and so she is articulate. This is part of the reason we invited her to Casual Connect San Francisco. She is also a mom. But the main reason we asked her along is she that she plays games. She plays a lot of games.
Despite the current economic situation and last year currency collapse, Russian mobile market is rapidly growing. Compared to 2014 statistics, it has increased by 186% and continues to grow in 2015. This growth is attributed to the fact that the Russian market is captured by cheap Chinese smartphones. People try to save money during an unstable economic period and go for inexpensive things. They would rather stay at home than go to the cinema or theater, or some other place where you can spend money. All these facts eventually translate to more games installs and in-app purchases. That’s why Russian mobile market remains interesting to foreign mobile apps and games publishers.
Faced with low production budgets and tight deadlines, many mobile game developers often devote their scarce cash resources on marketing/discovery — but little or nothing on protecting their app from malware, IP theft and other security threats. But ironically, marketing a game actually helps make it even more vulnerable to hacking, because if it grows in popularity, hackers are much more likely to identify the game as a good candidate for exploitation. This puts mobile game developers in a Catch-22 position: If their game doesn’t earn much money or downloads, it’s relatively safe from security breaches — but when it is successful, it becomes a target for malicious attacks which can undercut any revenue the game might have earned. DFC Intelligence founder and CEO David Cole explains more.
In recent years DFC Intelligence has focused on segmenting the diverse base of game consumer types. The most important trend that is emerging in the game market is the growth of consumers that play on multiple platforms. For example, almost all console players also play on PC to some extent. Increasingly both console and PC gamers are playing on mobile devices.
Lilia Ortiz is a freelance writer, graphic design student, and bookworm with three years of writing and editing experience, particularly on lifestyle, design, and tech topics. She edited “Pax the Polar Bear,” a children’s book on global warming. Now she shares what she learned about the popularity of poker in this article.
Even if you’re not an avid poker fan, you probably know it’s possible to play the game online and on mobile devices. In fact, online gaming is one of the main reasons behind the popularization of poker. According to a report by GiGse, the Global International Gaming Expo, the U.S. online poker market is the largest in the world. Additionally, The Online Poker Magazine notes the increased use of smartphone devices has allowed poker players to enjoy the game anywhere, anytime.
A Brief History of Online Poker
In 2006, the Unlawful Internet Gaming Enforcement Act (UIGEA) was passed, which prohibited online gambling businesses in places where the practice is deemed unlawful. Before this law was passed, the online poker market was controlled by a small number of public and private Internet poker operators in the UK, Antigua and Barbuda, and the Mohawk Territory of Kahnawake, states the GiGse report.
The Unlawful Internet Gaming Enforcement Act prohibited online gambling businesses in places where the practice is deemed unlawful.
After the UIGEA was enacted, private corporations, such as PokerStars and Full Tilt Poker, took over much of the market. Then, on April 15, 2001, also known as “Black Friday,” PokerStars and Full Tilt Poker were shut down. Understandably, the online poker market suffered and has yet to recover. However, there are still U.S.-based Internet poker operators that allow play online, many of which require a low deposit. At the moment, there is no federal law restricting U.S. players from playing online poker, nevertheless, laws differ by state.
The Trends in Online Poker Gaming
A 2013 online gaming survey by The NPD Group found that 72 percent of U.S. gamers prefer playing games online.
The online poker craze is directly correlated to the overall increase in online gaming. A 2013 online gaming survey by The NPD Group found that 72 percent of U.S. gamers prefer playing games online. It also reported an increase in the average number of hours played per week. And the number of online gaming sites, running the gamut from children’s games to action shooters, has skyrocketed along with it.
But where does poker stand amongst this online gaming surge? Money4Poker estimates there is $1.4 billion in online poker revenues along with 15 million online poker players worldwide. Out of these 15 million players, 13 percent of them have only ever played on one online card game site. Based on these numbers, it is safe to say that the convenience and availability of online poker has, without a doubt, turned poker into a game for the masses.
Mobile Gaming and Poker
CardsChat, a worldwide poker community, reports the wide access of mobile poker sites has led to a massive growth of the game around the world. Players are no longer restricted by location or device; plus, with the advent of new smartphone technology, they don’t have to sacrifice quality when playing on a smartphone or tablet, reports The Online Poker Magazine.
Players of mobile poker oftentimes use virtual currency due to regulatory concerns.
It should also be mentioned that mobile poker is not usually played for real money stakes. Players of mobile poker oftentimes use virtual currency due to regulatory concerns. Even so, a Juniper Research report found an increase in profits from in-app purchases for free-to-play casino-style games, including poker. This unique style of gameplay awards players with better in-game options and a higher-quality mobile gaming experience.
The Future of Online and Mobile Poker
The future of online and mobile poker in the U.S. is still uncertain. However, recent changes regarding online gambling have spurred its legalization. It is likely that California will legalize online poker in 2015, reports CardPlayer. New Jersey, Nevada, and Delaware legalized online poker in 2013, so it’s only a matter of time before more states follow.
Although the entire issue is still up in the air, many industry experts believe the legalization of online poker is inevitable, since it would benefit Indian tribes, particularly in California. Before passing an online poker bill, there are four stages a state must consider, comments Poker News: finding out if online poker will benefit the state and its inhabitants, having all the major interests agree, working out compromise details, and negotiating political support.
A managing partner of Bitfold Online Games, Mike Turner knows his way around the design and development of mobile and social games. He also plays the role of analyst at times. He looks into how system performance data matters for game analytics in this article.
The social and mobile gaming revolution in 2009 transformed the usage of analytics in gaming from something mainly used in MMO games to a universal best practice for all games. In subsequent years, the analytical methods adopted to analyze and affect user behavior have become very advanced. Today’s game analytics focus on:
Data mining: Executing specialized queries into behavioral data to get a granular picture of user actions and preferences. User segmentation: Segmenting users into meaningful cohorts and maximizing positive behavior of each player segment. Predictive modeling: Using statistical models to predict which changes will increase retention, strengthen engagement, and maximize paid conversions and user spending. Custom KPIs: Establishing actionable performance indicators custom to each game (e.g., paid user conversion at specific key events, churn rate after particular engagement goals).
Successful developers today are experts at employing these advanced methods to gain deep insight into what their users like and providing content and features that keep them engaged.
Game companies don’t often pay enough attention to how the system performance affects their numbers. Skilled usage of behavioral analytics enables developers to create targeted content and features which keep their users engaged. However, mishandled system errors can cause significant disruption to user experience and properly managing them is a weak point of many developers. Technical errors such as bugs, unexpected downtime, and latency happen a lot, and they are typically not noticed until they manifest in a game’s KPIs.
DeltaDNA, a leading gaming analytics platforms, cites technical issues as one of the top barriers preventing players engaging with games.
Optimally though, developers should be detecting and fixing system errors before they damage a game’s numbers. This article will focus on how to combine behavioral analytics with system performance analytics to avoid the negative effects of technical errors and maximize a game’s retention, engagement, and monetization numbers.
System Errors Create Noise in Behavioral Analytics Data
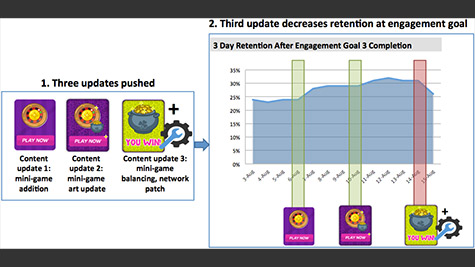
Once a system error begins, it’s often not noticed until it shows up as a negative trend in behavioral analytics. Sometimes, it is obvious that the negative trend is due to a technical error. But sometimes, it’s unclear whether it’s a system issue, an unbalanced gameplay feature, or content that users don’t like. To determine which possibility it is, analysts generally have to mine deeply into their data to determine the affected users and conditions correlated with the negative trend.
An example of this is portrayed below:
If it is determined that the negative trend has been caused by a technical issue, it means two things:
- The issue has been allowed to persist long enough to damage the game’s KPIs and has cost the developer money.
- Data about which individual features and content users prefer have been obfuscated by technical error, making it more difficult to establish clear conclusions on what changes should be made to the game to better engage users.
Diagnosing game error with behavioral analytics tools is not desirable. A better approach is to use log management tools specifically designed to monitor system health and error logs to diagnose and fix errors.
Diagnosing game error with behavioral analytics tools is not desirable.
Below we examine how to implement log management alongside behavioral analytics to ensure that behavioral data collected is representative of a (mostly) bug-free gameplay experience, and that technical errors are eliminated before they can cause disruptions in gameplay experience or game revenues.
Using Log Management Tools to Detect System Errors Before Users Find Them
To find errors early, you want to use tools that provide you real-time system health data and help you detect and fix technical errors within a short timeframe (optimally less than a day). Most of this data can be surfaced by logging your application and the clients and servers it is installed on. Implementing logging is very similar to how you would implement behavioral analytics. You have to decide what data is important to track, but avoid inundating yourself with too much garbage data.
You have to decide what data is important to track, but avoid inundating yourself with too much garbage data.
For system data, you want to log:
● Information about the performance and health (CPU usage, memory allocation, etc.) of the servers your game exists on
● Information about your server-side application’s performance and behavior
● Information about your database performance
● Information about your client’s behavior, the state of the device it’s being used on, client-side network conditions, and code that interacts with your server application. If your game is client-only, you should still log crashes, exceptions, and select information on the application’s behavior to help you quickly determine what’s causing bugs in your application, should they arise.
However, once you log this data, it’s unwise to simply dump it to file to be searched later. To work with this data deftly, you need a place that gives you tools for properly monitoring and analyzing it.
Centralizing Logs and Isolating Issues with Log Management Platforms
Sending logs to log management providers like Loggly provides developers with mature tools to monitor log data in real-time and quickly analyze it to find the causes of technical issues. These tools include automatic log centralization and organization, search tools that enable you to search log data with custom parameters, visualization tools which represent log data in a variety of chart types that help developers identify errors and performance trends, and system monitoring and alert tools that monitor logs for abnormal behavior and send your team email, SMS, or PagerDuty alerts when there are errors or deviations from optimal system health.
When combining these tools, you provide the capability for your live operations team to know of errors immediately via alerts and provide them tools to search logs quickly for the root cause. This allows many errors to be solved BEFORE they’re able to effect your game’s behavioral analytics. Even if some issues do escape early detection, and show up in your gameplay metrics, developers will be able to diagnose and fix them much faster with good logging tools than without.
How to Pair Log Data Management with Behavioral Analytics to Provide Better Gameplay Experiences for End-Users
Let’s re-examine the game-update example above assuming the availability of log management tools from programs such as Loggly. After the update, the live operations team notices retention suffering. With Loggly in place, the team can cross-reference both their behavioral data and log data to quickly determine if the cause is due to a technical error or to user dissatisfaction with the update’s content. If the cause is determined to be a system error, developers can use Loggly to diagnose and fix the error quickly.
In the case above, if the issue in retention was not due to system errors or bugs, the analysts would be able to use Loggly to rule out the possibility of system errors quickly and focus on re-balancing the gameplay.
Best Practices for Combining Logging and Behavioral Data
Be Predictive
You can use your behavioral analytics to tell which KPIs and user cohorts are most heavily affected by error. Once you have this data, identify all of the areas of system performance that can affect your KPIs. Send all logs surrounding those areas to your log management program, set up monitoring of those logs, and create alerts to monitor deviations from optimal performance.
For instance, our behavioral analytics might tell us that NON-hardcore gaming cohorts don’t accept much difficulty in the game or long waits at the loading screen. Therefore, we set up a saved search for SLA violations related to loading in Loggly, and set it to monitor these SLAs and alert Dev Ops teams when they happen.
Cross-Validate Issues
If an issue arises and it’s not clear whether it’s a system error or behavioral error, both pieces of data can be checked simultaneously to quickly rule out possibilities of system errors.
Use Logging to Check System State Before and After Release
At most successful game companies, releases happen almost daily. Use logging to check the system logs before and after releases to validate each release’s integrity. This will save the Live Ops team from having to spend time diagnosing and fixing technical issues down the line and prevent users from being affected by any bugs in a release.
Use Logging to Monitor Third-Party Vendor Integrations
Third-party integrations often have their own performance issues. For instance, ad impressions shown in your game will often take the form of interstitial video and rich media ads. However, if players are in areas of low connectivity or have slower devices, these ads can fail and interrupt the game experience. With logging, you’ll be able to tell when and how errors such as these are happening so that you can make corrections to your third-party integration and avoid future interruptions.
Conclusion
In game companies, most people on a Live Operations team have access to the game’s behavioral metrics and are always thinking about how their work affects them. By integrating a centralized log management into this process, the whole team will be encouraged to take the system’s health into account when analyzing user behavior and pushing new content and features. System issues have a significant and often hidden effect on your game’s key numbers. Proactively monitoring and fixing them frees up developer time and allows you to keep the money and users those issues would otherwise cost you.
SocialMonsters‘ creative teams works to provide insight into new ideas and interesting stories. Josh Stoddard, a content advocate at SocialMonsters, shares what they discovered about Twitch.tv.
Live video game streaming is the entertainment of the future. Twitch.tv is a fast-growing live streaming resource for gamers everywhere. In fact, Twitch.tv has more than 45 million viewers every month. With popular game titles and growing viewer and user base, gamers are using Twitch to earn money and gain recognition. Check out this infographic for more information on Twitch’s rapid rise:
Involved in the entertainment industry since 1993, DFC Intelligence researches the digital entertainment markets and provides an analysis of issues and trends in many different parts of the world. They also provide data and consulting services to many companies in the global digital entertainment business. They share some of their thoughts and findings on their recent brief on Candy Crush Saga and mobile games.
With Candy Crush Saga, King has shown that casual games can not only generate huge amounts of revenue, but also that they can have long legs, which is clearly the holy grail of the game industry.
On May 7, King announced results for the first quarter of 2014. These results were quite strong, even if investors may not have been ecstatic. With Candy Crush Saga, King has shown that casual games can not only generate huge amounts of revenue, but also that they can have long legs, which is clearly the holy grail of the game industry.
Earlier this month, DFC Intelligence published a brief entitled “Candy Crush Saga and What it Means for Mobile Games“. That brief took a detailed look at Candy Crush Saga and how King built it into a mega-hit, including an overview of how King’s extensive knowledge of casual games and experience with delivering social games set them in a position to have one of the biggest success stories in game industry history.
We have done our best to let the numbers speak for themselves, but as an editorial comment, we note that Candy Crush Saga has had very long legs, even if it does show signs of slowing.
This article looks specifically at how Candy Crush Saga and King performed in the first quarter of 2014. The focus is on mobile revenue and usage, where King has seen the most rapid growth. We have done our best to let the numbers speak for themselves, but as an editorial comment, we note that Candy Crush Saga has had very long legs, even if it does show signs of slowing.
Candy Crush Saga Numbers
For the first quarter of 2014, Candy Crush Saga had gross bookings of $430 million, which was down about 13 percent from the fourth quarter of 2014, where gross bookings were $493 million. Investors clearly don’t like to see declines, but these numbers remain staggering for a casual game that is two years old. Overall, it is a great sign for the casual game industry. It shows that when a company has a hit, they can have a nice period of time to deliver a second act.
Going forward, the Candy Crush Saga numbers look very positive for any sequels and spin-offs King may look to release. There is also potential upside as Candy Crush Saga has now gone into China via a partnership with Tencent. Of course, very few, if any, casual games will be the next Candy Crush Saga. Nevertheless, there are many lessons that can be learned from King. At the very least, it is a clear message that successful casual games have greater distribution and revenue potential than ever, and most importantly, they can generate revenue for quite a long time.
Candy Crush Saga Monthly Mobile Downloads 2013-2014
Source: Priori Data
Candy Crush Saga is an interesting case, because it built an active user base over time, even though a large portion of downloads were in the first part of the year. According to Priori Data, Candy Crush Saga was downloaded 268 million times during 2013. Nearly 60 percent of those downloads occurred in the first half of the year. However, it is clear that downloads have leveled off versus plummeting, which is good news for a game that wants to have longevity
Candy Crush Saga Monthly Active Mobile Users 2013-2014
Source: Priori Data
The Monthly Active User (MAU) base for Candy Crush Saga remained remarkably steady from June 2013 onward, even as downloads started to decline significantly. What this means is that users continued to play the game and there were probably even a great deal of lapsed users that came back.
Candy Crush Saga Monthly Mobile User Churn 2013-2014
Source: Priori Data
Mobile User Churn is a measurement of how many users were lost month over month. The lower the number, the better. It is clear that after starting with a high churn, Candy Crush Saga had low churn while adding users. DFC attributes this to the social network snowball effect that helped keep users engaged.
King Revenue by Platform: 2012-2014
Source: Public Filing, in millions
In the first quarter of 2014, gross bookings for King were fairly flat versus the previous quarter. Bookings on mobile were up, while web/Facebook bookings were down slightly. Candy Crush Saga revenue was down 13 percent, but it was replaced by growth in Farm Heroes Saga.
King Monthly Active Users and Monthly Unique Users: 2012-2013
Source: Public Filing, in millions
Monthly Active Users (MAU) is the number of people that played a specific game within a given month. With MAU, there will be double counting of users that play multiple games. Monthly Unique Users (MUU) is the number of people that played any game within a given month. This eliminates the double counting. Because Candy Crush Saga was the dominate game for King, MUU was incredibly high.
King DAU by Game
Source: Public Filing, in millions
King Monthly Unique Payers: 2012-2013
Source: Public Filing
Monthly Unique Payers (MUP) is the number of people that purchased an item from one of King’s games in a given month. Clearly the number of MUP is on a downward trend, but it remains very high.
In order to receive a complimentary copy of the brief “Candy Crush Saga and What it Means for Mobile Games” from DFC Intelligence, click here.
Sabrina Carmona is a Live Game Manager and Associate Project Manager for Square Enix Latin America, having worked as a Game Producer for many years. Sabrina also co-founded the Brazilian studio MangoLab and was the Executive Coordinator for the CS:Games academic research group in Sao Paulo, Brazil. She provides a view of the Latin American industry in this article.
The Latin American game industry is still considered a myth among many people outside the area. This article will focus on showing how the area is expanding and enhancing a bit on what the market consumes, and what the developers are looking for.
The Latin America Mobile Market
When talking about Latin America, we certainly think about Argentina, Brazil, and Mexico. However, those are not the only ones to be considered, since expansion and technology is reaching out for countries like Chile, Colombia, and Venezuela. However, I will share some data collected from Our Mobile Planet, on the three major markets in Latin America, just so we can have a starting point in what to look at, and what to expect, from the area.
First and foremost: do they actually have a smartphone? Yes. Lots. The data regarding smartphone population in comparison to the total population goes as follows:
Now, these percentages might look low, but when we take a look on how many people we actually have there, it gets really interesting. Argentina has a total population of 41.66 million people, which leaves us with a surprising number of approximately 1.35 million smartphones. The total population of Brazil is 199.32 million people, having an impressive number of approximately 7.66 million smartphones! As for Mexico, there is a total population of 117.41 million people, which amounts to approximately 3.71 million smartphones.
So is there a consuming market in Latin America? I do believe so! Many of the smartphone owners are really engaged in their gadgets, and according to more data gathered, they use their phones mostly for social networks, emails, games, and apps in general, as you can see below:
And not only are they engaged with what the smartphone has to offer, they also state that basically, they can’t live without it anymore! They say that they won’t leave their homes without it, and some of them would even give up their TV for their smartphones.
So now that we know that there is a market, we should jump to our next question: is there an industry?
The Latin America Game Industry
It is really hard to talk about all the studios and projects in the Latin American industry and everything that happens, since they are growing up so rapidly and effectively. It is very complicated to find accurate numbers on how many companies we have in Latin America, or how many games were developed in 2013, for instance, but a general view on the studios is as follows:
- Due to having more experienced people in the industry, a lot of good professors and tutors are starting to teach in the many undergraduate, graduate, and free courses in the area. Because of that, better-qualified professionals are entering the industry and showing their talent with the companies they are working for.
- The indie game scene is huge! There are a lot of talented people that are developing amazing games and being able to develop top quality projects with impressive art, creative mechanics, and much more. If you have no idea of what they are doing, you must definitely play Oniken, Toren, and Out There Somewhere. They ought to impress you!
- Game events are becoming more popular through the years! Not only are more Latin companies attending international events, but also the audience in the internal events is growing even more. Just to exemplify, Brazil Game Show, which is the largest event in the area, had more than 150,000 people attending in its 2013 edition.
- Latin American companies are developing games that are getting international recognition, proving that with little investment, you can still make quality products, such as Knights of Pen and Paper, Kingdom Rush, and Juego del Chavo.
The Next Big Thing
Now, here is the final point: the Latin American market is dying for new products that are targeted to them. Latin American companies are talented and thirsty for new challenges and projects. It is just a matter of time before they start ruling the market, and what it takes for them to start is investment.
It is just a matter of time before they start ruling the market, and what it takes for them to start is investment.
We all know that the economy in these countries is tricky, and that it is about to grow. Still, it does not allow most studios to only focus on their own IPs, forcing them to divide their time with work-for-hire so that they can maintain themselves.
More and more publishers are looking at this market and industry, and that is a great start for Latin studios to show the potential they have, and for the global publishers to bite a great piece of this huge market. And it will be just a matter of time before we see Latin games on the global Top 10 of mobile stores. All they need is a chance to prove their value.
A guest post from Animoca describing research done on the Android tablets.
Our series about the most common smartphones and their OS versions in each country generated numerous requests for specific data (yes, we’ll get to Europe soon!). One of the most frequent requests was to issue something on the tablet market. In this post, we’ll break down the most popular tablets worldwide. You can check out our other posts describing individual Android smartphone markets: Hong Kong & India | Singapore | USA | Japan.
One in four Americans now owns a tablet device, according to Pew Research, and analyst firm IDC reports that the worldwide tablet market grew more than 78% year-on-year in 2012. IDC predicts that 190 million tablets will be shipped in 2013, with a forecast 48.7% growth over last year.
All data obtained from individual users of Animoca games worldwide who used Google Play and who played an Animoca game on a tablet device between February 18 and March 20, 2013.
So with tablet sales not slowing down any time soon, let’s see which Android tablets are currently the most popular on the Animoca network of Android users.
All data obtained from individual users of Animoca games worldwide who used Google Play and who played an Animoca game on a tablet device between February 18 and March 20, 2013.
Top Android tablets worldwide (Animoca network, Feb 18 - Mar 20, 2013)
Rank
Device
Share
Screen Size (inches)
1
Samsung Galaxy Tab 2 7 (includes p3100+p3113)
11.8%
7
2
Samsung Galaxy Tab 2 10.1
8.3%
10.1
3
Amazon Kindle Fire
7.5%
7
4
Amazon Kindle Fire HD
4.9%
7
5
Samsung Galaxy Tab
4.8%
7
6
Asus Google Nexus 7
3.8%
7
7
Samsung Galaxy Note 10.1
3%
10.1
8
Asus Transformer TF101
0.9%
10.1
8
Asus TF300
0.9%
10.1
9
Samsung Galaxy Tab 7.7
0.8%
7.7
10
Samsung Galaxy Tab 8.9
0.7%
8.9
11
Motorola Xoom
0.6%
10.1
11
ONDA MID Tablet
0.6%
7
11
Acer Iconia Tab (A200)
0.6%
10.1
11
Sony Tablet S
0.6%
9.4
12
Toshiba Thrive AT100
0.5%
10.1
Error margin: +- 0.1%
Sample size: 978,000
Assumption: there are 75 million Android tablets in circulation worldwide
Immediately you’ll note that 4 of the top 5 tablets, and 6 out of the top 10, are of the smaller variety, featuring 7-inch screens. This should come as no surprise, given that one in every two tablets shipped last quarter had a screen size of less than 8 inches.
Once again, we note the prominence of Samsung devices; apparently, the Korea-based company dominates tablets as well as smartphones. Next up, the Amazon Kindle and Kindle HD account for more than 12% of the tablets on our network – quite remarkable for devices that are still not globally available. The popular and zippy Google Nexus 7 came in 6ᵗʰ place, suggesting that Google will be a significant player in the hardware wars.
Once we account for Samsung, Amazon, and Google, the rest of the field is wide open. After the top 7 tablets, the devices claiming under 1% of the Animoca Android network became too numerous to list here. In fact, given an error margin of 0.1% and the slight differences between tablets in 8th place and onwards, we cannot be entirely sure of the correct ordering.
What we can be confident of is that tablet sales won’t slow down any time soon, and that developers should be creating mobile apps built to suit their users. Knowing which tablet or tablets you are developing for is useful knowledge – not only screen size, but also other hardware specifications.
When we looked at Japan, we saw what seemed to be a preference for one-handed gaming on smartphones being used in portrait mode; perhaps the popularity of 7-inch tablets has something to do with a similar global trend. Of course, it could just be that the 7-inch tablets strike an ideal balance of price, portability, and form factor.
Join us next time for more Animoca data, and be sure to follow us on Twitter for additional insights!


 The Monthly Active User (MAU) base for Candy Crush Saga remained remarkably steady from June 2013 onward, even as downloads started to decline significantly. What this means is that users continued to play the game and there were probably even a great deal of lapsed users that came back.


 Monthly Active Users (MAU) is the number of people that played a specific game within a given month. With MAU, there will be double counting of users that play multiple games. Monthly Unique Users (MUU) is the number of people that played any game within a given month. This eliminates the double counting. Because Candy Crush Saga was the dominate game for King, MUU was incredibly high.

 Monthly Unique Payers (MUP) is the number of people that purchased an item from one of King’s games in a given month. Clearly the number of MUP is on a downward trend, but it remains very high.